


Pollution and Resources
Responsible Consumption and Production
Life Below Water
Life on Land
Partnerships for the Goals
Importance and Mission
The food and beverage industry is seen as a major consumer of plastic packaging, particularly single-use plastics, a key contributor to hard-to-degrade waste that negatively impacts the environment, marine ecosystems, and the human food chain.
Ichitan Group Public Company Limited recognizes the importance of addressing the waste problem and is committed to contributing to concrete solutions. The Company prioritizes waste reduction at the source through the efficient use of resources, following the 3Rs principle (Reduce, Reuse, and Recycle), alongside systematic sorting and classification of plastic waste for effective reuse, lower production costs, and reduced environmental impact.
In addition, the Company promotes waste management under the “Circular Economy” concept, aiming to minimize the amount of waste sent to landfill and reduce the use of virgin plastic packaging. This is achieved through collaboration with business partners in the research and development of sustainable and environmentally friendly packaging. The Company has set corporate sustainability goals to ensure 100% of its packaging is recyclable, supporting the circular use of resources and reducing long-term environmental impact.
Stakeholders Directly Impacted

Consumers

Employees

Society and Community

Business Partners / Creditors
Goal and Performance Highlights
Goals
Performance Highlights

Reduce non-hazardous and hazardous waste by

Reduce non-hazardous and hazardous waste at the source by
Reduction of greenhouse gas emissions totaled
Management Approach
- Set goals, policies, and operational guidelines for waste and waste generated from production processes, ensuring compliance with regulations, requirements, and laws pertaining to landfill waste and packaging waste as stipulated by the Department of Industrial Works and other relevant government agencies.
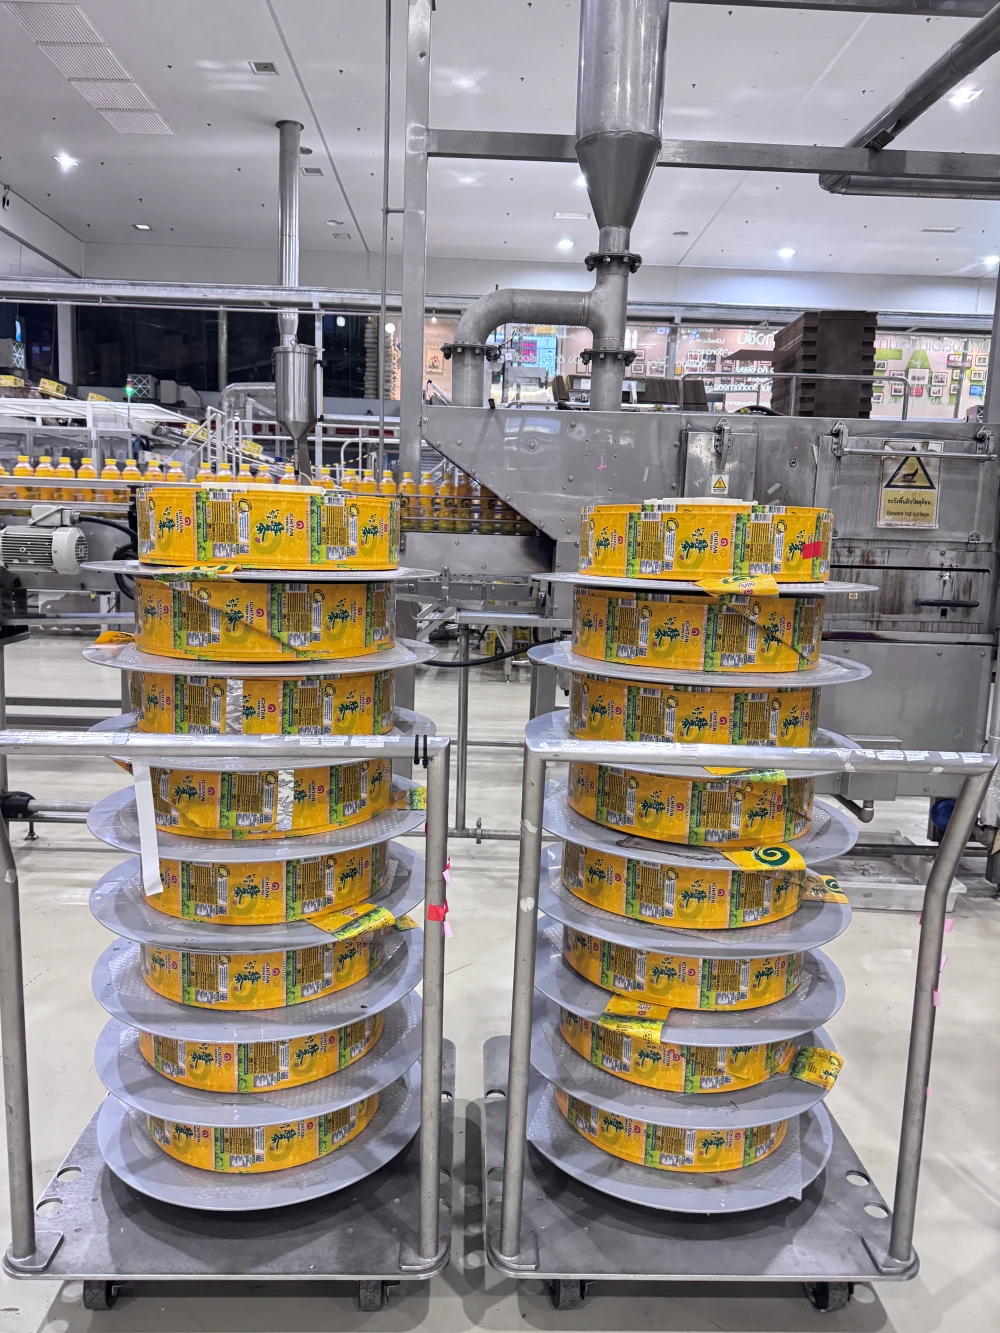
- The Company operates under the 3Rs principle – Reduce, Reuse, and Recycle – aligned with the “Circular Economy” concept. This approach aims to minimize unnecessary resource use in the production process and reduce the amount of waste sent for disposal or landfill.
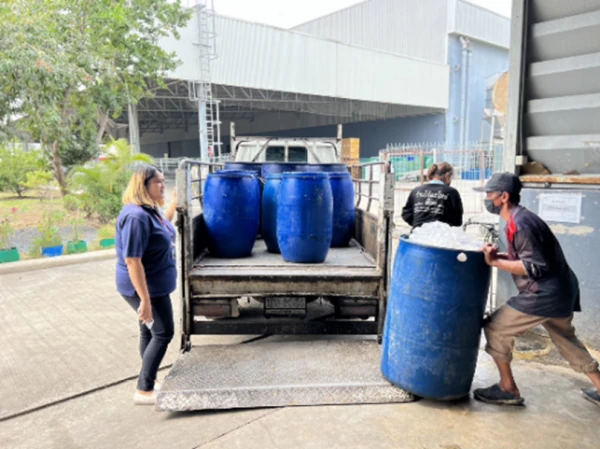
- Reduce landfill waste disposal by diverting food waste to nearby fish farmers or aquaculture practitioners for use as animal feed, thereby reducing food waste accumulation that may result in adverse impacts on the natural ecosystem.
- Building a network of collaboration with business partners, government agencies, independent organizations, and stakeholders across the value chain to research and develop sustainable packaging. This involves reducing the weight of virgin plastic preform while maintaining product quality and functional efficiency, ultimately improving the standards of waste management and production process waste handling.
- Collect packaging from end consumers nationwide, working with business partners through various initiatives to ensure systematic plastic waste classification and sorting.
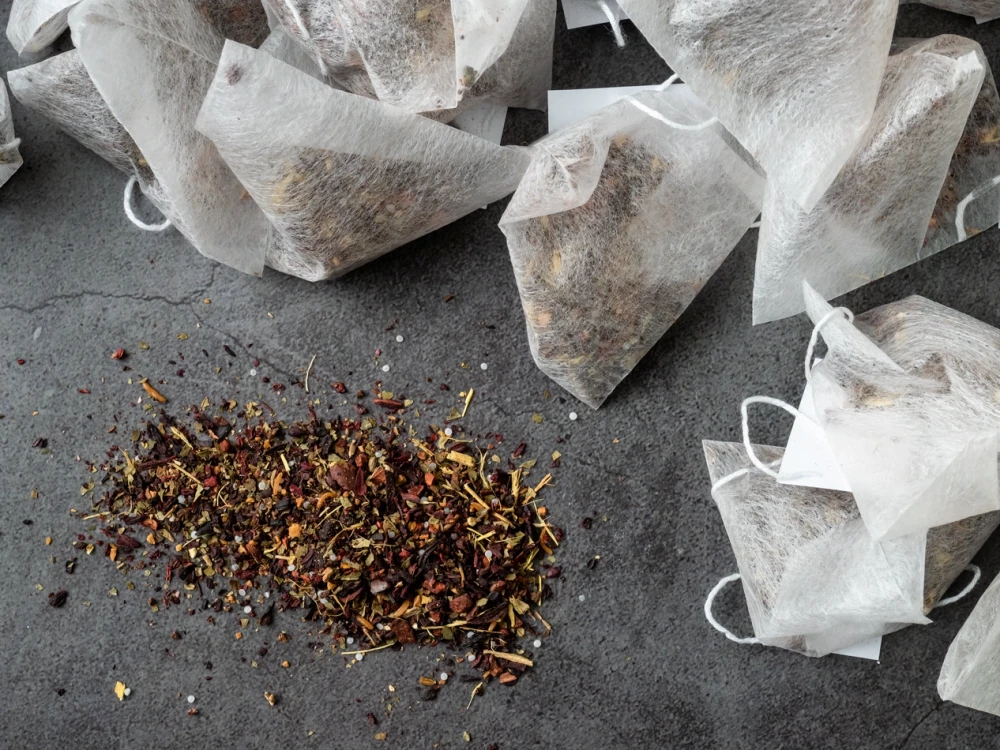
- Promote efficient resource use and support the circular economy by returning used tea bag sacks from production to partners for reuse in packaging tea leaves directly from farms, before they re-enter the production cycle.
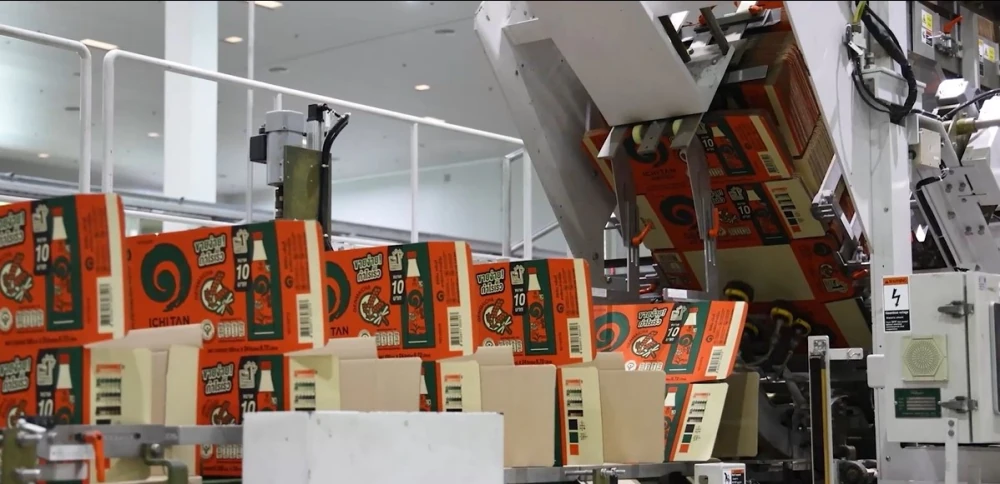
- Promote the use of environmentally friendly packaging by supporting the procurement of corrugated cardboard boxes made from recycled paper sourced from certified manufacturers, to reduce natural resource consumption and minimize packaging waste.
Implementation and Performance
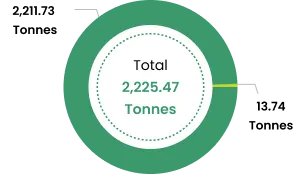
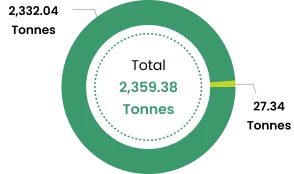
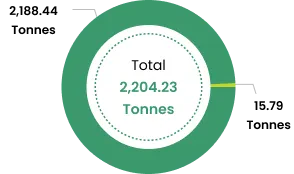
Total waste generation data
2023
2024
2025
(Unit: Tonnes)
| Waste Volume | 2023 | 2024 | 2025 |
|---|---|---|---|
| Quantity of Hazardous Waste Generation | 13.74 | 27.34 | 15.79 |
| Quantity of non-hazardous waste generation | 2,211.73 | 2,332.04 | 2,188.44 |
| Total | 2,225.47 | 2,359.38 | 2,204.23 |
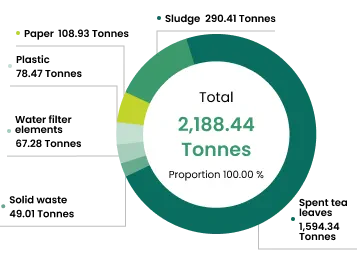
Non-hazardous Waste Data Categorized by Material Type
Waste Volume

Plastic
78.47 Tonnes
Proportion 3.59%

Paper
108.93 Tonnes
Proportion 4.98%

Sludge
290.41 Tonnes
Proportion 13.27%

Spent tea leaves
1,594.34 Tonnes
Proportion 72.85%

Solid waste
49.01 Tonnes
Proportion 2.24%

Water filter elements
67.28 Tonnes
Proportion 3.07%
(Unit: Tonnes)
| Waste Volume | 2025 | Proportion |
|---|---|---|
| Plastic | 78.47 | 3.59% |
| Paper | 108.93 | 4.98% |
| Sludge | 290.41 | 13.27% |
| Spent tea leaves | 1,594.34 | 72.85% |
| Solid waste | 49.01 | 2.24% |
| Water filter elements | 67.28 | 3.07% |
| Total | 2,188.44 | 100% |
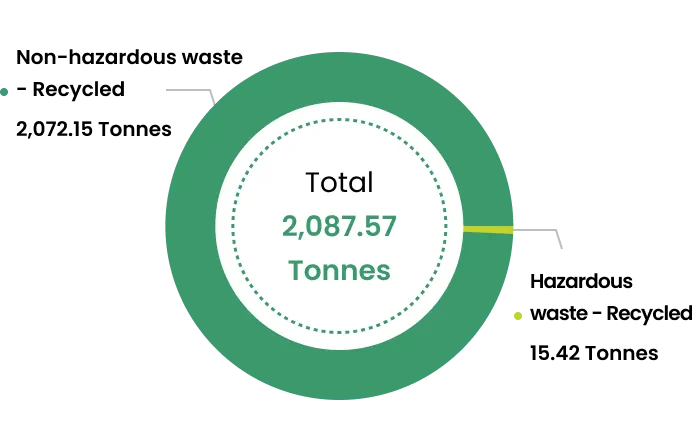
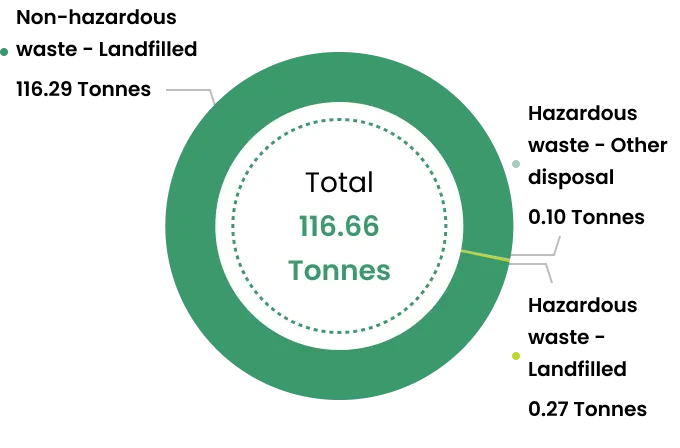
Total Waste Directed to Recovery and Total Waste Directed to Disposal
Total waste diverted from disposal
Total waste directed to disposal
| Performances (Unit: Tonnes) | 2025 |
|---|---|
| Total waste diverted from disposal | 2,087.57 |
| Hazardous waste - Recycled | 15.42 |
| Non-hazardous waste - Recycled | 2,072.15 |
| Total waste directed to disposal | 116.66 |
| Hazardous waste - Landfilled | 0.27 |
| Hazardous waste - Other disposal | 0.10 |
| Non-hazardous waste - Landfilled | 116.29 |
Goals for 2025
Reduce non-hazardous and hazardous waste by
80%
of the total amount generated.
Performances
Reduce non-hazardous and hazardous waste by
2,087.57 tons annually
a reduction of 94.71%.